Historic & Present Population
Table 2A: Falfurrias, Population Change, 1960- 2010
|
Year |
Falfurrias |
Brooks County |
State of Texas |
|
1960 |
6,515 |
8,609 |
9,579,677 |
|
1970 |
6,355 |
8,005 |
11,196,730 |
|
1980 |
6,103 |
8,428 |
14,229,191 |
|
1990 |
5,788 |
8,204 |
16,986,540 |
|
2000 |
5,297 |
7,976 |
20,851,820 |
|
2010 |
4,981 |
7,223 |
25,145,561 |
|
2012 (estimate) |
5,363 |
N/A |
Source: US Census Bureau, Profile of Demographic Characteristics, 1960-2010.
Over the past 50 years, the population of Falfurrias has declined each decade from a height of over 6,500 residents in 1960 to less than 5,000 in 2010. Over the same period, the population of Brooks County has also shrunk from 8,609 residents to 7,223 residents. The State of Texas grew each decade. Housing and water connection costs indicate that the City has experienced growth since the 2010 Census.
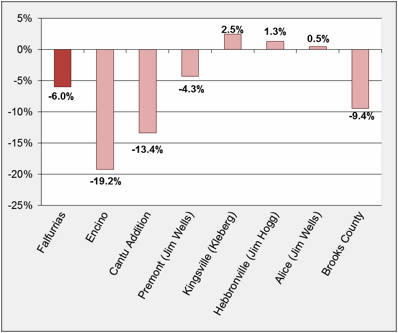
Regional Population Change : As illustrated in Chart 2A, regional population change from 2000 to 2010 ranged from significant population decline at -19.2% to slight population increase at 2.5%. Falfurrias and the small communities in Brooks County including Encino and Cantu Addition all experienced population decline over the last decade. Premont in Jim Wells County just north of Falfurrias also shrunk while the other larger cities in the region grew slightly. This indicates that Falfurrias residents are leaving Brooks County and locating in surrounding communities.
Chart 2A: Regional Population Change, 2000 – 2010

Population Characteristics
The analysis of Falfurrias’s population characteristics uses data from US Census Reports for 2000 and 2010. The analysis identifies racial breakdown, disability status, and age cohort information in the city’s population.
Project Beneficiaries by Sex, Race and Ethnicity. Table 2B: Population by Race & Ethnicity, 2000-2010 describes how the population’s race and ethnicity changed during the last decade.
In 2010, Falfurrias’s White population comprised 89% of the total population. The percentage of citizens of all races who describe themselves as Hispanic/Latino totaled over 90% in both 2000 and 2010. The City’s African American population grew slightly during this decade. Combined, all non-white racial categories comprised approximately 25% of the population in 2000 and only 11% of the population in 2010. This decrease is caused by a sharp decline in residents who identify themselves as being a part of the “other” race category. All other race categories remained relatively stable between 2000 and 2010.
The Brooks County population is similar to the race and ethnicity of Falfurrias residents. Falfurrias residents make up two-thirds of the County’s population. It is the County’s only incorporated city. As compared to Falfurrias and the County, the State has a much lower percentage of Hispanic/Latino residents (32%) and a significantly higher percentage of Black/African American residents (12%).
Table 2B: Population by Race & Ethnicity, 2000 - 2010
|
Falfurrias |
Brooks County |
|||||
|
2000 |
2010 |
2010 |
||||
|
Characteristic |
Number |
% |
Number |
% |
Number |
% |
|
Total Population |
5,297 |
100% |
4,981 |
100% |
7,223 |
100% |
|
White |
3,984 |
75% |
4,422 |
89% |
6,471 |
90% |
|
Black or African American |
13 |
0% |
27 |
1% |
37 |
1% |
|
American Indian, Alaskan Native |
29 |
1% |
24 |
0% |
25 |
0% |
|
Asian |
7 |
0% |
20 |
0% |
21 |
0% |
|
Native Hawaiian / Other Pacific Islander |
6 |
0% |
0 |
0% |
1 |
0% |
|
Other |
1142 |
22% |
405 |
8% |
570 |
8% |
|
Two or More Races |
116 |
2% |
83 |
2% |
98 |
1% |
|
Hispanic or Latino |
4902 |
93% |
4,582 |
92% |
6,590 |
91% |
Source : 2000 and 2010 U.S. Census
